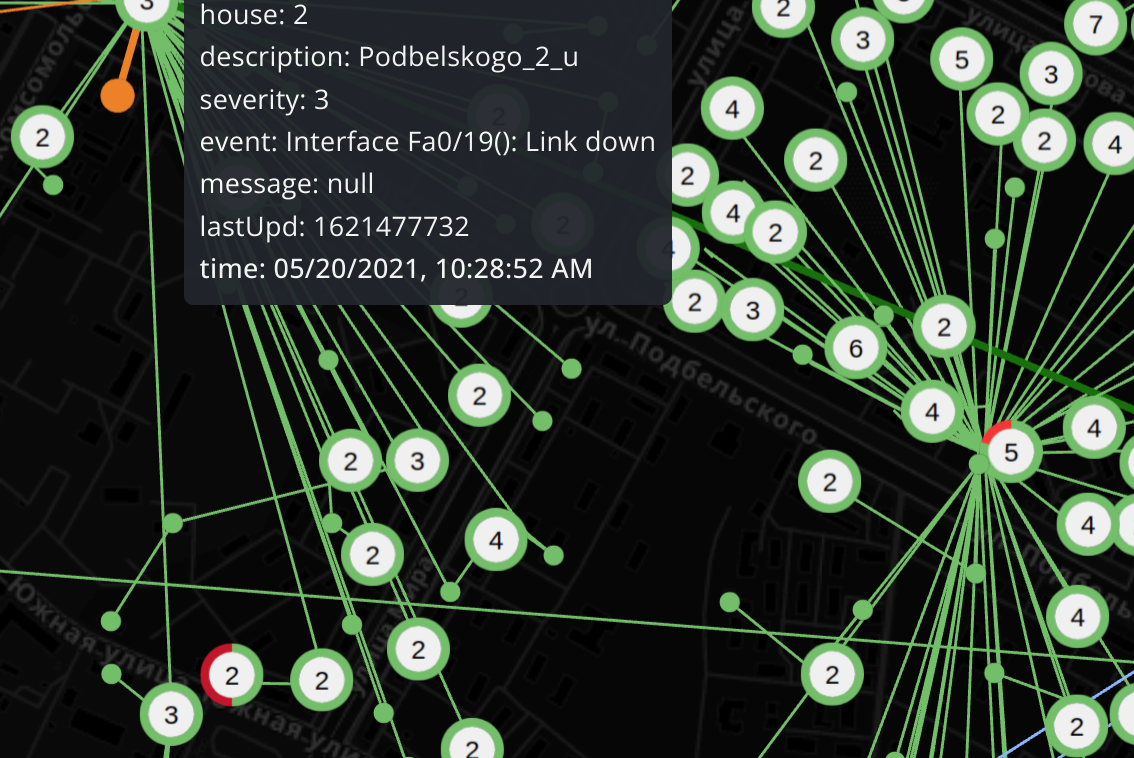
Tutorial: Observing Zabbix events on a Geospatial Map#
Option A. Coordinates from separate DB.#
Select a mixed datasource in panel query editor:
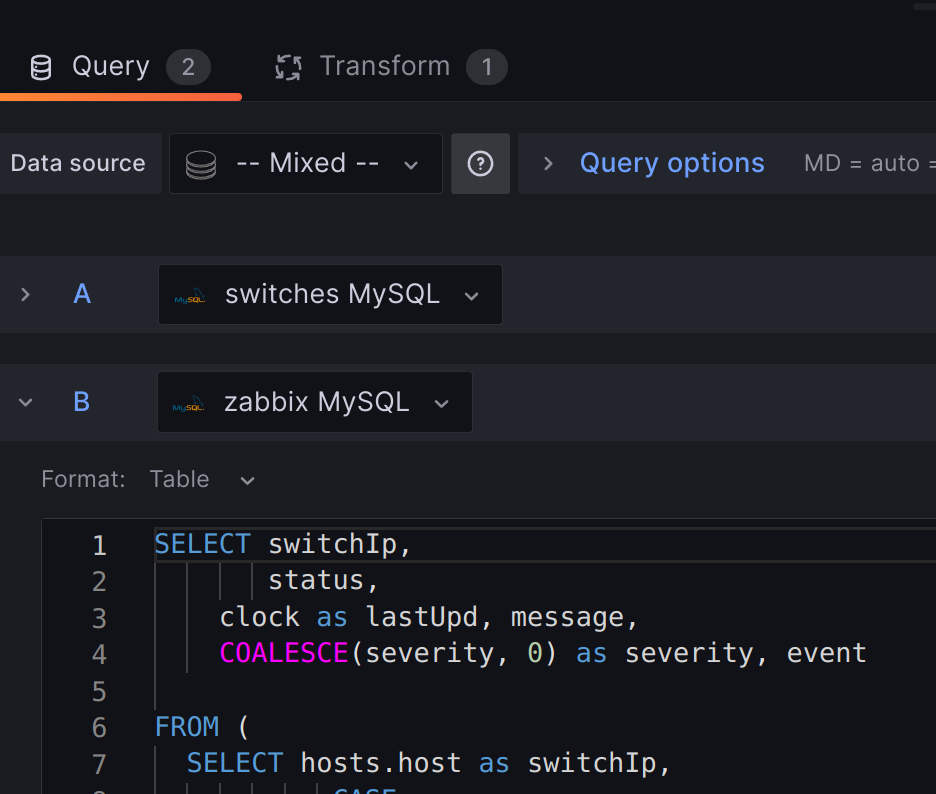
Datasource 1: Mysql#
Let's assume you keep coordinates, child/parent relations, and other important hosts information in a separate DB. Switch to 'Code' mode from 'Builder' and make a similar query:
SELECT
  sw.addr switchIp,
  sw.vendor_id vendorId,
  sw.topology_level topologyLevel,
  c.name city,
  s.name street,
  h.name house,
  psw.addr parentSwitchIp,
  ST_X(h.coordinate) longitude,
  ST_Y(h.coordinate) latitude,

 FROM TCC.switch_a sw

 WHERE c.name = "$city" OR IF("$city"="All",1,0) = 1
- Alternatively you can fetch Zabbix Mysql (Postgres) DB if you have coordinates and other info filled out in hosts inventory.
$city - is a sample Grafana variable you can set in dashboard options to group your points in every query. Its value options can be also automatically queried from the same datasource:
SELECT name FROM TCC.cities UNION
SELECT 'All' AS name;
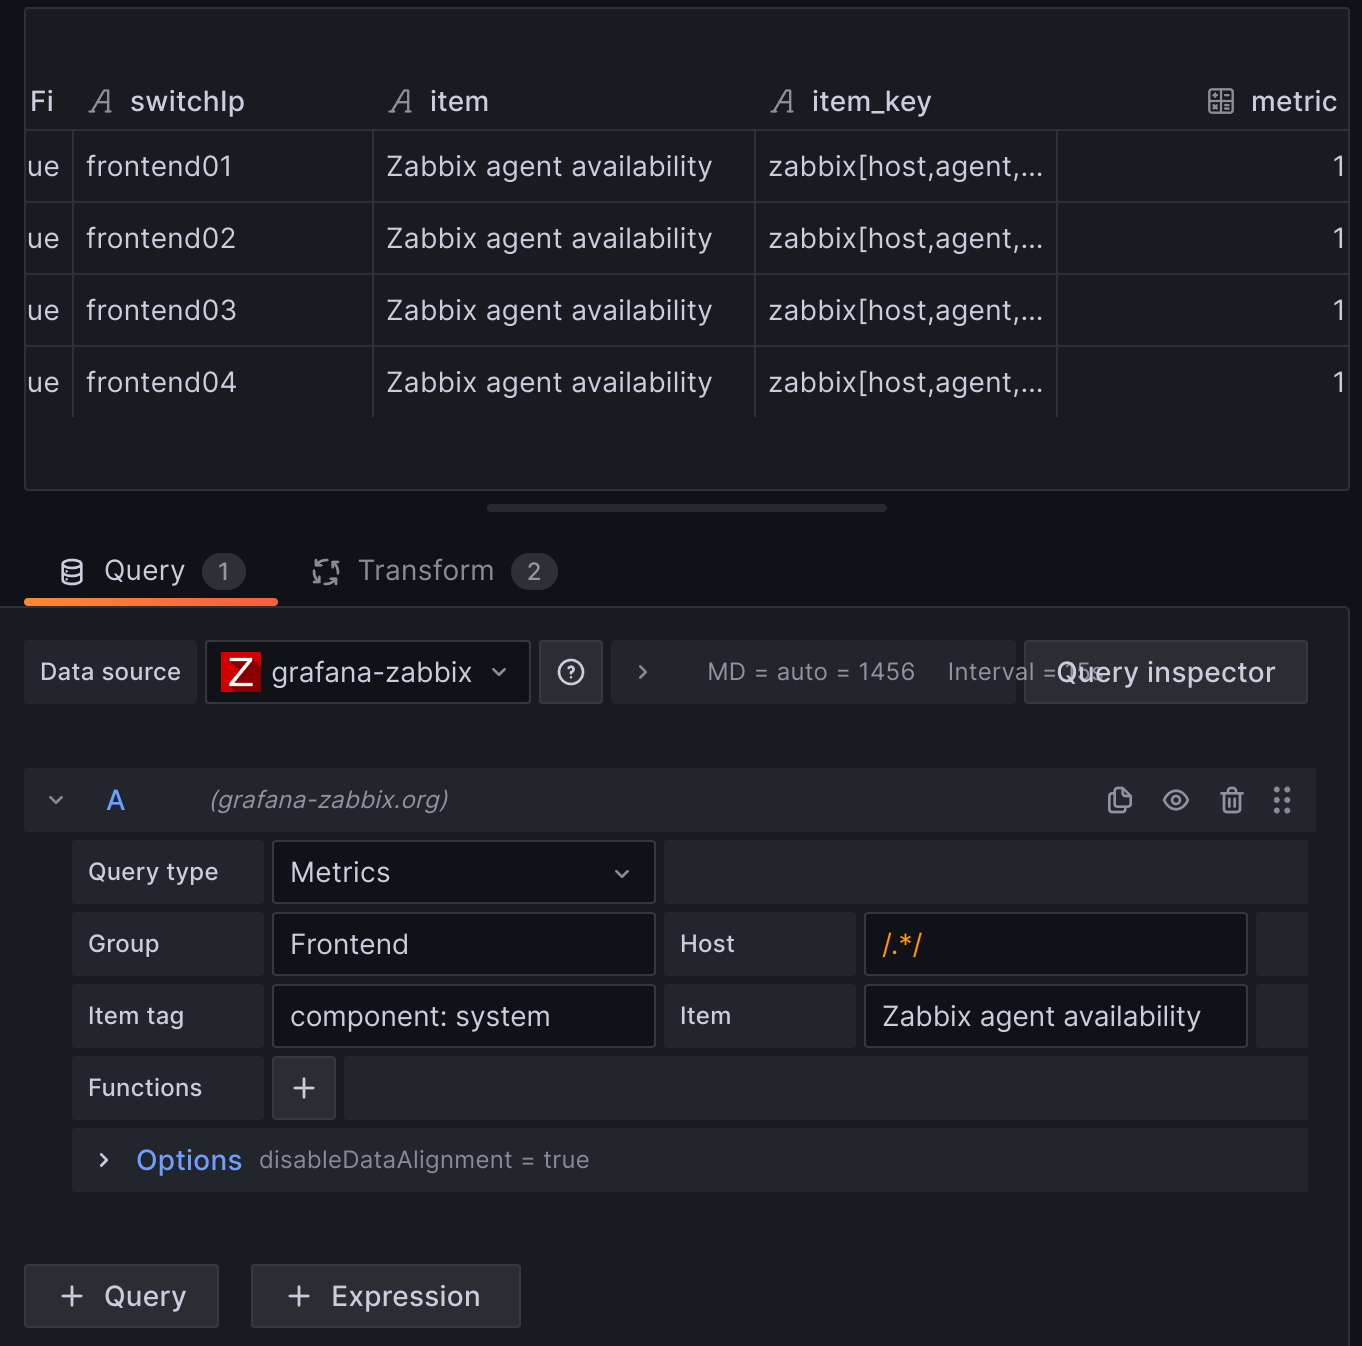
Datasource 2: Grafana Zabbix plugin datasource#
Use Grafana Zabbix plugin datasource for metrics query
 At the transform section apply 'Reduce' --> 'Series to rows' transformation with 'First non-null value' option in 'Calculations'.
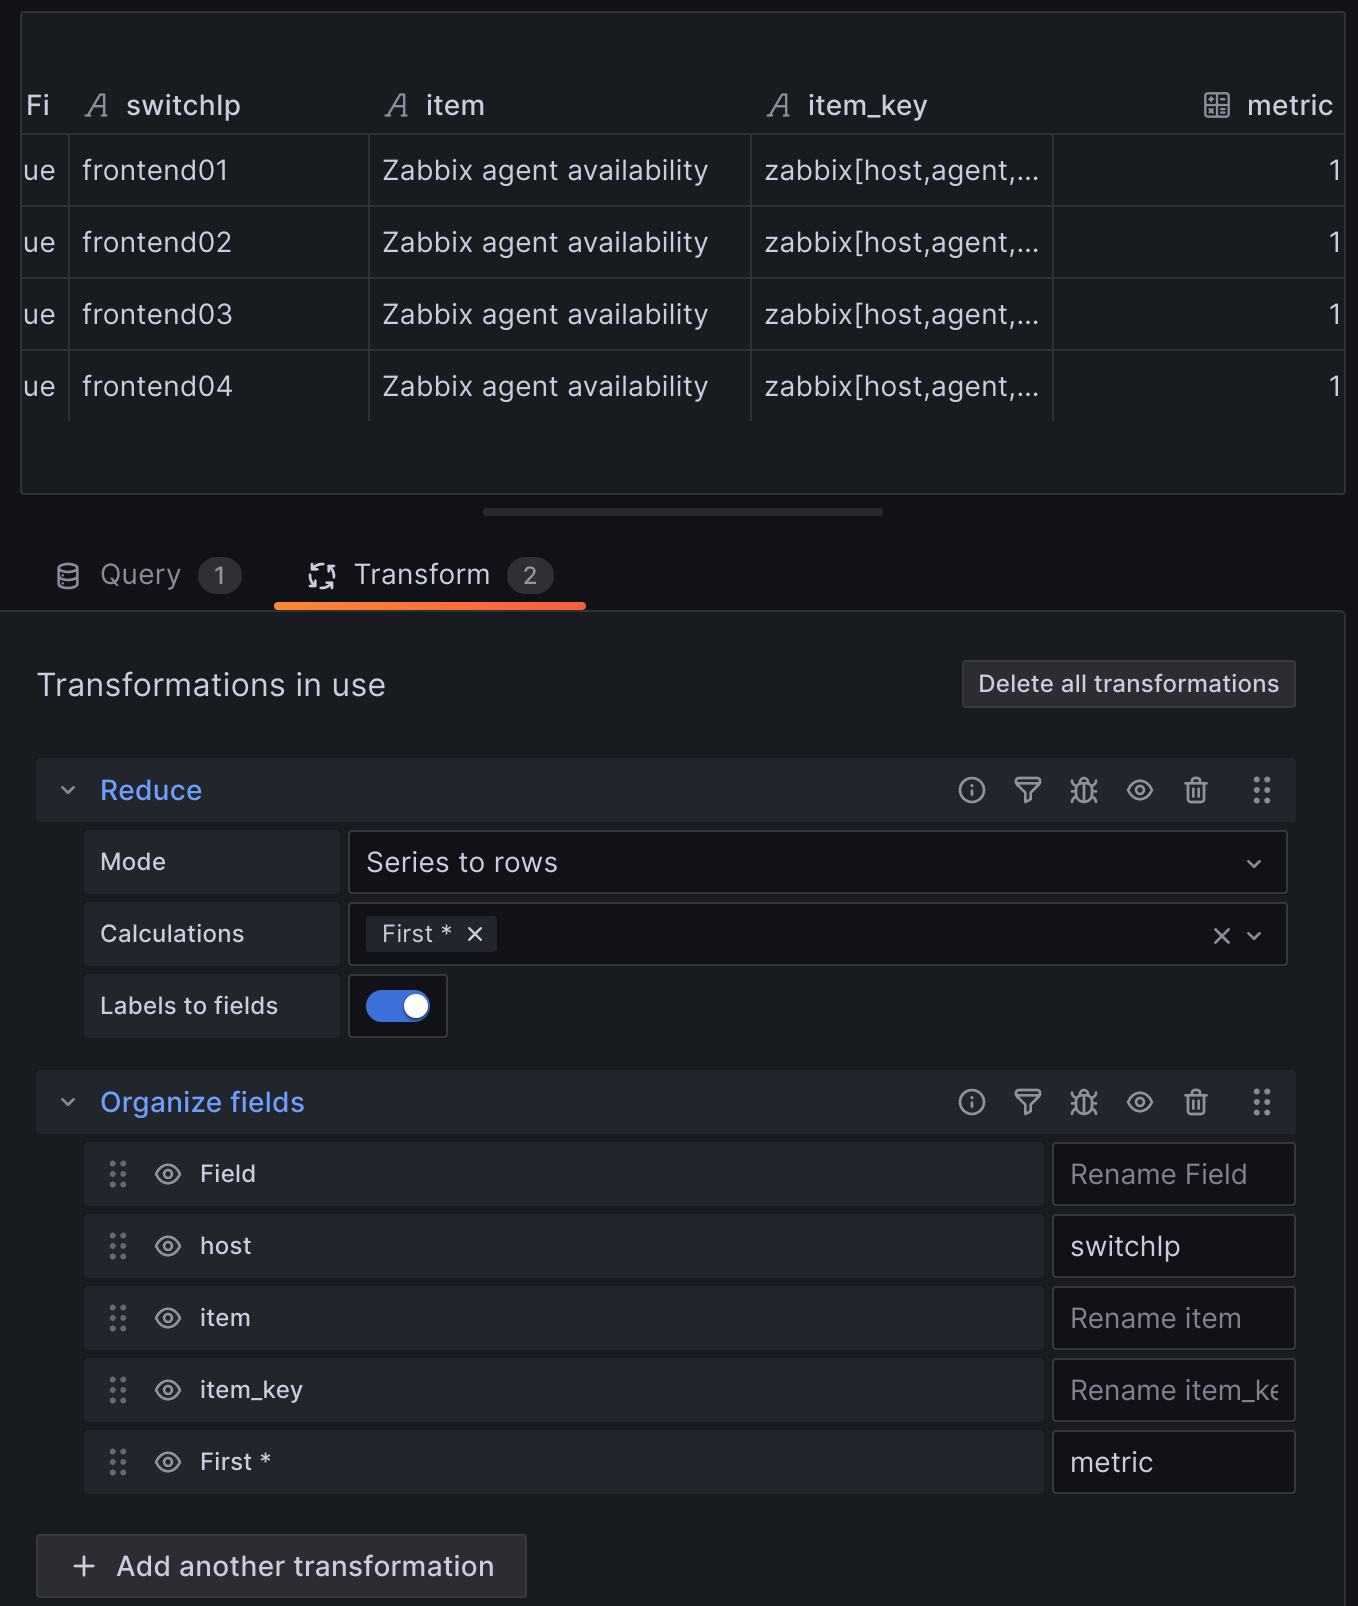 Use 'Organize fields' transformation to rename fields so they match your Datasource 1 target field (location name)
Skip to Inner join transformation
Datasource 2: Zabbix Mysql DB#
Get problem events with messages (acknowledges), severity metrics from Zabbix Mysql DB:
SELECT switchIp,
       status,
    clock as lastUpd, message,
    COALESCE(severity, 0) as severity, event

FROM (
  SELECT hosts.host as switchIp,
           CASE
         WHEN triggers.value = 1 THEN 0
         ELSE 1
         END AS status
         , events.clock as clock, a.message AS message, p.severity as severity, events.name as event
  FROM events
  JOIN triggers ON events.objectid = triggers.triggerid
  JOIN functions ON functions.triggerid = triggers.triggerid
  JOIN items ON items.itemid = functions.itemid
  JOIN hosts ON items.hostid = hosts.hostid
  JOIN problem p on events.eventid = p.eventid

  LEFT JOIN acknowledges a on events.eventid = a.eventid

  WHERE events.source = 0 AND p.severity > 2 AND triggers.value = 1

  UNION

  SELECT hosts.host as switchIp, history_uint.value as status, history_uint.clock as clock,
'' AS message, null AS severity, null AS event
  FROM hosts, items, history_uint
  WHERE
    hosts.hostid = items.hostid and
    items.itemid = history_uint.itemid and
    items.name = 'ICMP ping' and
    history_uint.clock between  (unix_timestamp() - 90) and unix_timestamp()
) as combined_result
ORDER BY clock DESC;
- 'Union' operation is intended to fill in the information about hosts, that are not covered by the 'problem' table. We're going to need this in order to transform our Grafana mixed datasource with INNER JOIN by the location name (switchIp) field
- 'Coalesce' for 'severity' sets null values to 0. It makes all severity values numeric, so that you can set color thresholds for these values.
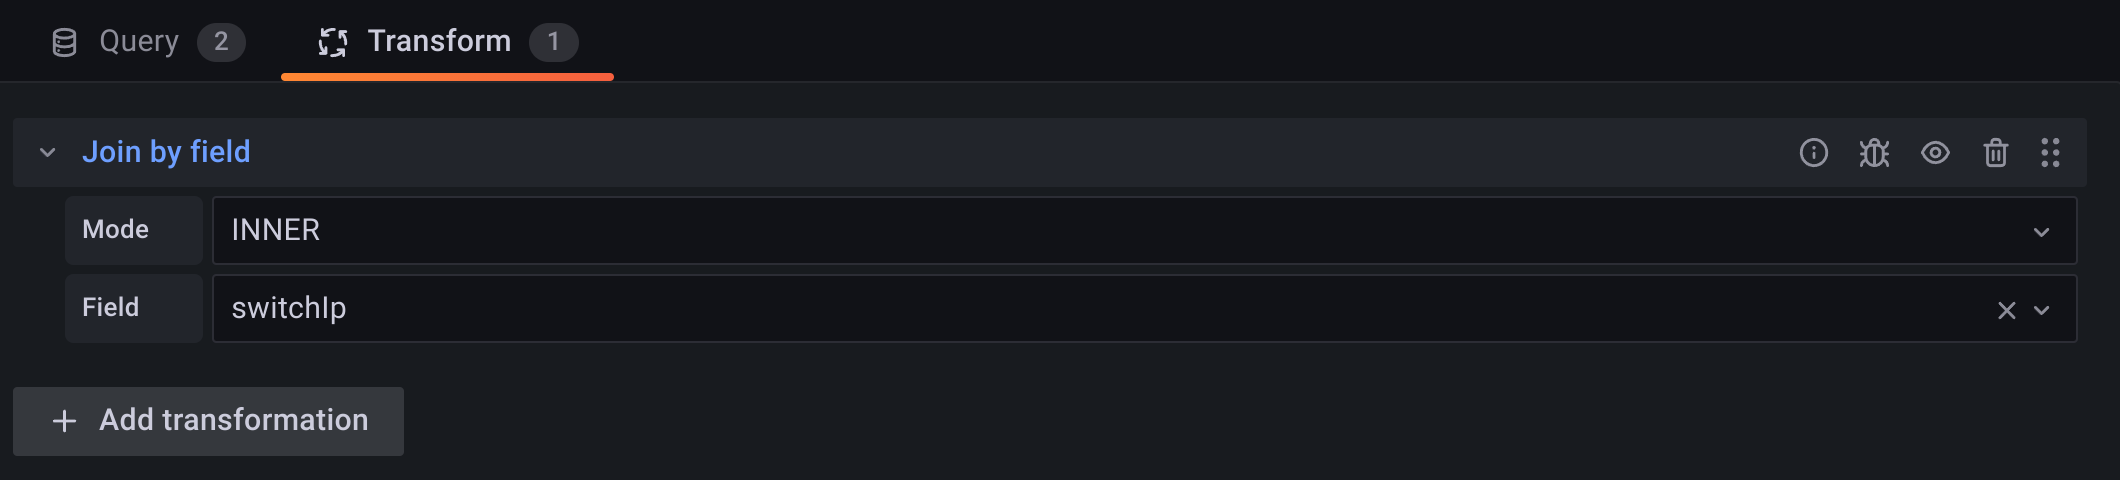
Transform#
Choose 'Join by field' mode: "INNER", and select location name field (switchIp)
Option B. From host inventory#
When Zabbix hosts inventory contains coordinates you can query Zabbix Mysql (Postgresql) database:
SELECT
hstgrp.name AS "Host Group",
h.name AS "Visible name",
hi.location_lat,
hi.location_lon,
hi_inventory.location
FROM
zabbix.hstgrp hstgrp
JOIN
hosts_groups hg ON hstgrp.groupid = hg.groupid
JOIN
hosts h ON hg.hostid = h.hostid
JOIN
zabbix.host_inventory hi ON h.hostid = hi.hostid
LEFT JOIN
zabbix.host_inventory hi_inventory ON h.hostid = hi_inventory.hostid;
Which pulls the Host Group, Visible Name, Location Lat, Location Lon and Parent Device Name
As an example to get severity from Zabbix
SELECT name, severity FROM zabbix.problem
LIMIT 50
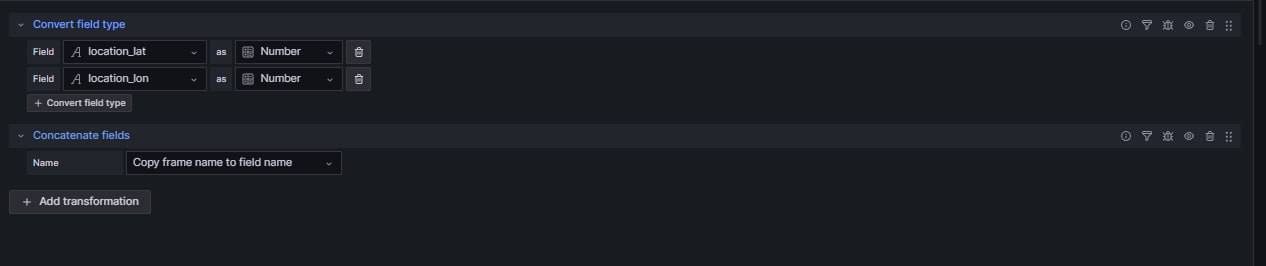
Then using the below transforms to change the values into numbers and then to concatenate the fields. So they form part of the same table.
*These query examples have been generously shared by the community.
Share your own effective queries for use with the Grafana MapGL plugin. Your input not only enhances the collective knowledge but also fosters collaboration within the Grafana community, allowing others to benefit from your valuable insights.
